
Redrawing the Poverty Line
The Pitch: Economic Update for December 4th, 2025

Friends,
Over Thanksgiving week, the economics world was swept up in a debate over how the federal government measures the poverty line in the United States. Finance writer Michael W. Green started the conversation with a bombshell newsletter on November 23rd.
Green explained that he had never questioned how the government calculates which families are living in poverty. The number, he writes, “seemed apolitical, an actuarial fact calculated by serious people in government offices. A line someone else drew decades ago that we use to define who is ‘poor,’ who is ‘middle class,’ and who deserves help. It was infrastructure—invisible, unquestioned, foundational.”
But Green’s acceptance of the poverty line came into question when he encountered a line in a research paper that explained how the poverty line was initially established. “The U.S. poverty line is calculated as three times the cost of a minimum food diet in 1963, adjusted for inflation,” the researchers explained.
Green dove a little deeper into the origins of the poverty line and discovered that the paper was true. “The formula was developed by Mollie Orshansky, an economist at the Social Security Administration. In 1963, she observed that families spent roughly one-third of their income on groceries,” he writes. “Since pricing data was hard to come by for many items, e.g. housing, if you could calculate a minimum adequate food budget at the grocery store, you could multiply by three and establish a poverty line.”
“Orshansky’s food-times-three formula was crude, but as a crisis threshold—a measure of ‘too little’—it roughly corresponded to reality,” Green continues. “A family spending one-third of its income on food would spend the other two-thirds on everything else, and those proportions more or less worked. Below that line, you were in genuine crisis. Above it, you had a fighting chance.”
You can probably guess the problem with using that metric to measure poverty more than a half-century later. It’s true that grocery prices have skyrocketed, particularly in the last five years. But Americans are paying so much more for so many other essentials than families in the early 1960s did—health insurance, housing, childcare, college tuition, cars—and while the poverty line does take inflation into account, it doesn’t include those other higher prices.
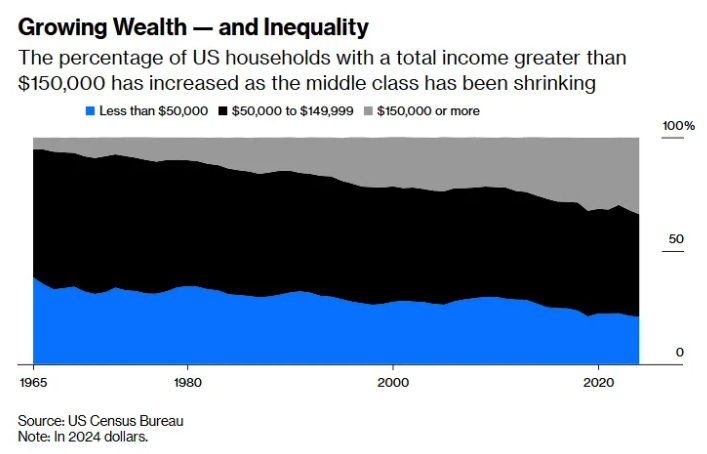
Green did a little back-of-the-envelope calculation incorporating those price increases and he came to his own poverty line measurement—one that set the economics world on fire: “if you measured income inadequacy today the way Orshansky measured it in 1963, the threshold for a family of four wouldn’t be $31,200,” Green writes. Instead, “It would be somewhere between $130,000 and $150,000.”
If that metric is anywhere near true, it means that millions of American households are silently struggling in poverty. And the number of families earning $150,000 or more annually been actively shrinking throughout the last four decades of the trickle-down era.
There’s much more at Green’s original post and you should read the whole thing.
Jared Bernstein wrote about the poverty line discussion and as usual his thoughts are worth your time. He points out that “Census poverty analysts are well aware of the shortcomings of the official line and have done solid work building out the Supplemental Poverty Measure, which includes both more costs and income, and allows key costs, like housing, to vary geographically.” Right now, the SPM stands near 13 percent of the population, while the traditional poverty line hovers around 10 percent.
Like many economic conversations, this argument over the poverty line is likely going to shift to a more academic tone, with lots of newly proposed formulas and metrics under debate. But it’s important to keep in mind that the questions Green raised are valid—as we’ll see in the conclusion to this email, so many Americans are reporting having trouble making ends meet that it’s clear our traditional economic measurements aren’t correctly capturing what it means to be a working American in 2025.
The idea of a poverty line is an important one because we need to understand how many Americans are unable to meet the basic necessities to survive. It’s important because we have to find ways to help those Americans survive—nobody should starve in the wealthiest nation in history—and also to stop people from falling out of the economy. We need to continually interrogate and adjust our measurements to make sure that we’re centering our economic data and policies around the experiences of working Americans, because that’s how we build a sustainable economy that grows for everyone. And we need to make sure that our data isn’t relying on economic metrics of 1963 to measure our economic health here in the 21st century.
The Latest Economic News and Updates
Checking in on Black Friday
On the day after Thanksgiving last week, Americans took advantage of holiday sales in record numbers. “U.S. consumers spent $6.4 billion on Thanksgiving Day and $11.8 billion online on Black Friday, both record highs and up significantly compared to last year,” writes Hugh Cameron at Newsweek.
But that doesn’t necessarily mean that consumer spending is healthy. Reports show that actual “order volume fell by about 1 percent year over year, while average selling prices were up 7 percent—indicating that much of the growth was caused by inflation rather than any uptick in shopping enthusiasm,” Cameron continues.
Put more simply, Black Friday sales numbers only climbed because prices rose, not because more Americans were shopping. And millions of Americans who did take part in Thanksgiving weekend sales were turning to buy now, pay later (BNPL) services like Klarna to purchase those items on credit—particularly on “Cyber Monday,” when online retailers roll out some of their splashiest sales.
Consumer usage of BNPL services “reached a record high, rising 4.2 percent year over year and driving over $1 billion in online spending on Cyber Monday,” Cameron writes. Experts expect “total BNPL spend to climb to $20.2 billion by the end of this year’s holiday shopping season, marking an 11 percent increase over 2024.” That’s a lot of bills that will come due in the first quarter of next year, which could hurt consumer spending and the economic well-being of American households for months to come.
And on Monday, President Trump claimed in a press conference that Americans weren’t paying higher prices at all. “The word affordability is a con job by the Democrats,” Trump said, adding, “The word affordability is a Democrat scam.”
As I mentioned, in the conclusion of this email we’ll look at what real Americans are saying about the economy. It’s an interesting choice for the President of the United States to try to deny that working Americans are struggling with prices. Politically speaking, that’s a move that doesn’t traditionally work out well for the deniers.
Paychecks Are Shrinking and Jobs Are Disappearing
The Trump Administration has cancelled the release of several important reports this month, claiming that the government shutdown made it impossible to compile accurate data. Those cancelled reports include the advance estimate of the third-quarter GDP, the October inflation report, and the October jobs report. This unprecedented lapse in data reporting leaves experts to turn to private businesses that regularly release economic data. Two days ago, payroll company ADP offered a window into November’s numbers for working Americans.
“The U.S. labor market slowdown intensified in November as private companies cut 32,000 workers, with small businesses hit the hardest,” writes Jeff Cox at CNBC.
Cox continues, “Larger businesses, entailing companies with 50 or more employees, actually reported a net gain of 90,000 workers. However, establishments with fewer than 50 workers saw a decline of 120,000, including a drop of 74,000 among firms with 20 to 49 employees.”
“The biggest loss came in professional and business services, which saw a decline of 26,000,” Cox writes. “Others shedding jobs included information services (-20,000), manufacturing (-18,000), and financial activities and construction, both of which saw losses of 9,000.”
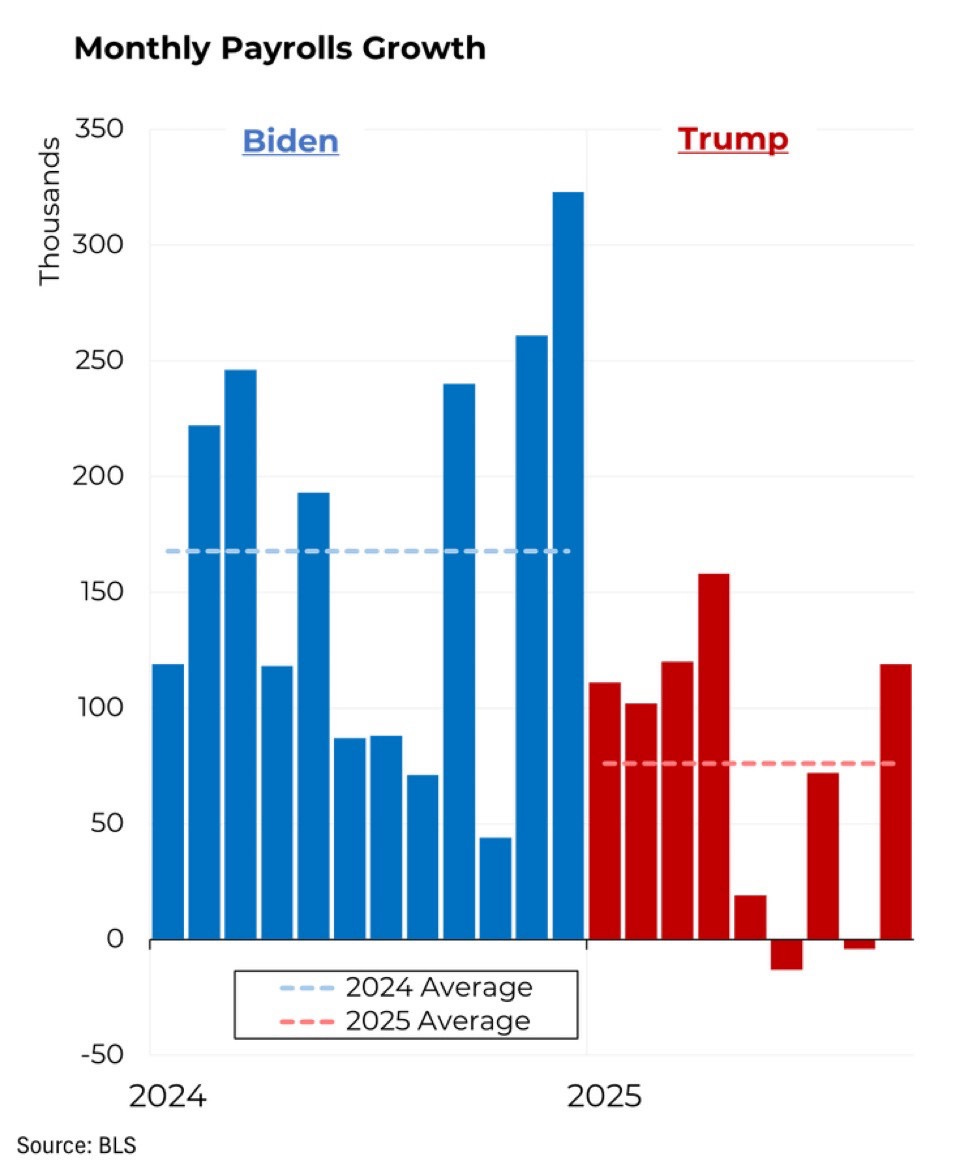
It all comes down to this: Average payroll growth has collapsed this year.
We’re also seeing that simply drawing a paycheck isn’t a guarantee that working Americans can participate in the economy. The Boston Globe’s Katie Johnston published an excellent expose on the employers in Massachusetts whose workers are enrolled as Supplemental Nutrition Assistance Program (or SNAP, commonly known as food stamp) recipients.
“In Massachusetts, 74 percent of working-age recipients of the Supplemental Nutrition Assistance Program are employed, half of them full-time,” Johnston writes. “In all, nearly 11 percent of the Massachusetts workforce receives SNAP benefits, slightly higher than the national rate of 10.3 percent.”
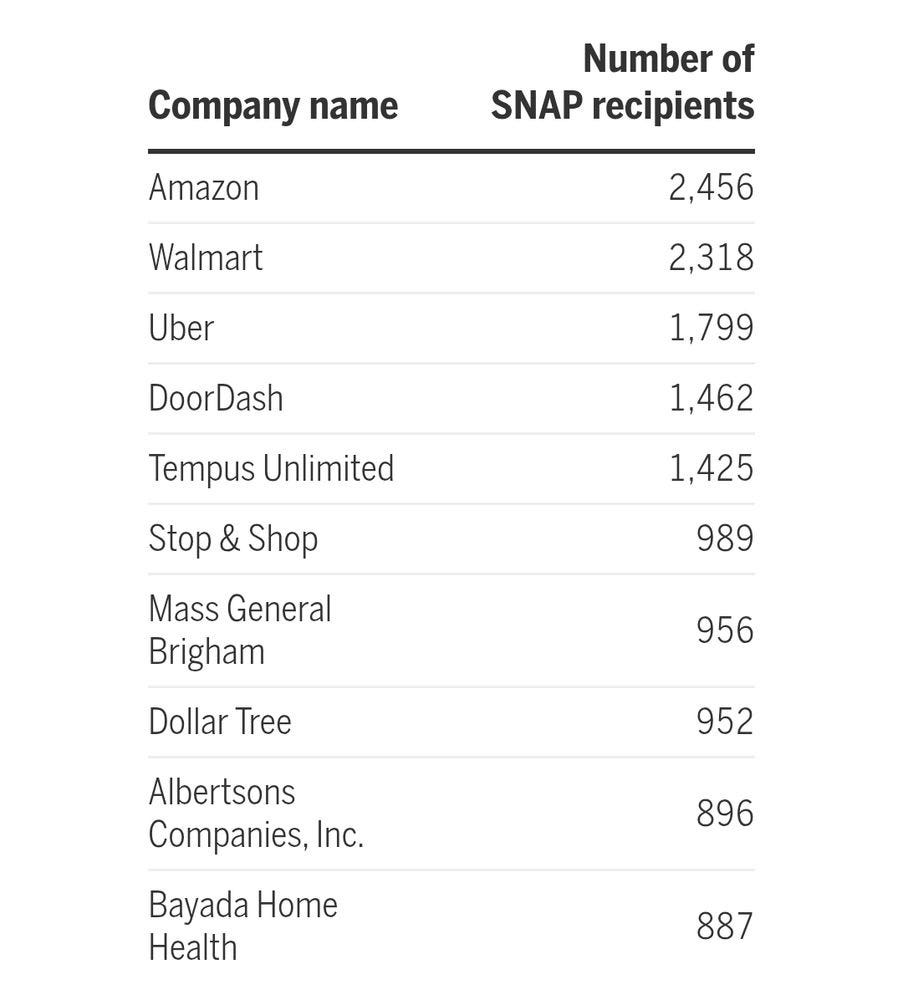
This means that more than one in ten workers are employed at a job which does not pay enough for them to feed their families. The employers who are the biggest offenders include highly profitable national corporations including Dollar Tree, Albertsons, and Walmart, gig economy employers like Uber and Doordash, and several large local employers including health care provider Mass General Brigham.
The worst offender is Amazon. Nearly 2,500 of their Massachusetts employees are enrolled as SNAP recipients, meaning that the government is subsidizing Amazon’s low wages in Massachusetts alone to the tune of millions of dollars every year.
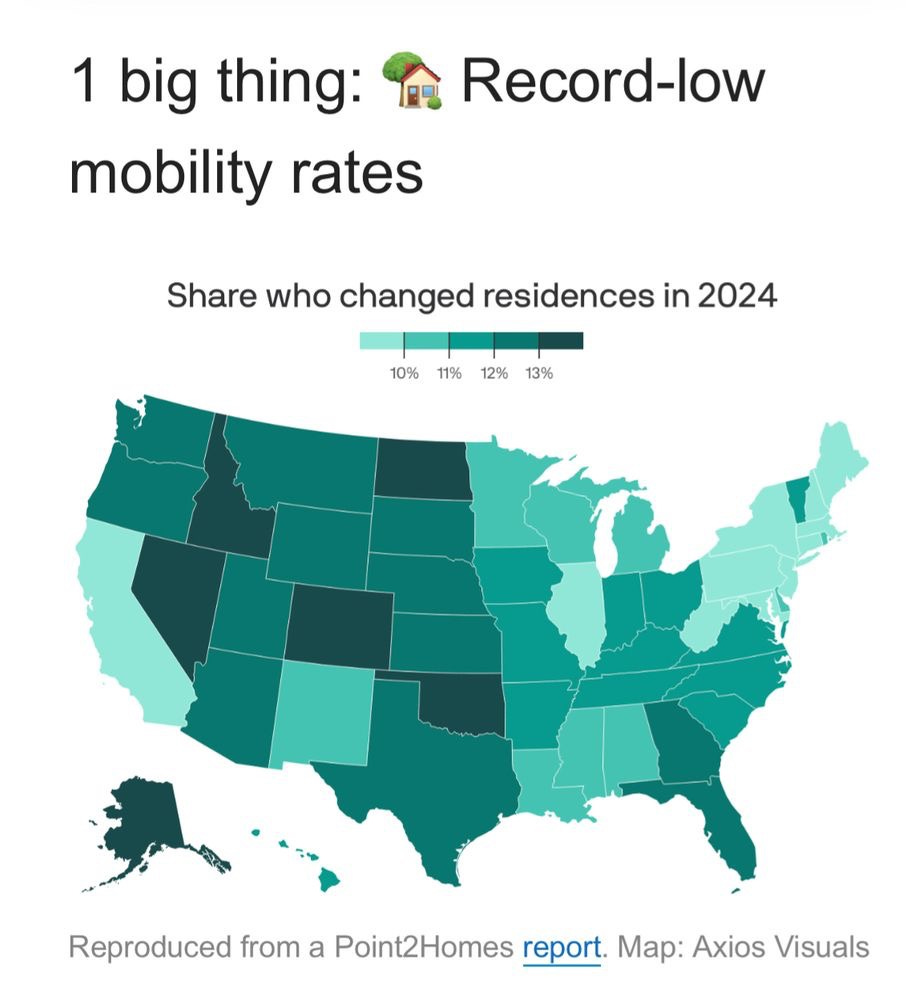
A Record-Low Number of Americans Are Moving
Last year saw the fewest number of Americans changing residences since record-keeping began in 1948. “Roughly 1 in 9 people (11%) changed residences last year — a record low,” reports Axios’s Sami Sparber. “That’s down from around 14% a decade ago and 20% in the 1960s.”
Sparber quotes the Atlantic’s Yoni Appelbaum, who claims the sharp “decline in geographic mobility is the single most important social change of the past half century,” because eighty years of economic data shows that “the people who have moved have done better economically than the people who stayed behind.”
In much the same way that workers who switch jobs are often rewarded with bigger paychecks, Americans who move from one part of the country to another tend to enjoy a higher economic status in the new location. People who stay in place are more likely to see their wages and wealth either stagnate or deteriorate as they have fewer opportunities.
Why are Americans staying put? It’s the affordability: Appelbaum cites “discriminatory zoning laws” and “community gatekeeping” as reasons why people aren’t moving, and that lack of growth is pushing up home and rental prices to prohibitive levels. It’s simply too expensive for Americans to move and survive the lean months of starting a new job and putting down new roots.
Plenty of American cities and states have recognized the existential problem of high housing prices, and we’re starting to see some interesting new policies in an attempt to address housing affordability. Susan Montoya Bryan writes for the Associated Press that Santa Fe, New Mexico, is “the first city in the United States to directly link wages to housing affordability, aiming to counter high rents by tying minimum wage increases to consumer prices as well as fair market rental prices.”
“Santa Fe’s minimum wage will increase to $17.50 starting in 2027,” she writes. “The annual increase historically has been tied to consumer prices, but going forward a new blended formula will be used to calculate the annual increase, with the Consumer Price Index making up one half and fair market rent data making up the other.”
“There’s a 5% cap in case costs skyrocket,” she writes, “and if consumer prices or rents tank in any particular year, the minimum wage will not be reduced.” Roughly 20% of Santa Fe workers will see a direct raise when the new minimum wage goes into effect, and studies show that many more workers who are hovering above the existing minimum wage will also see their paychecks increase.
Santa Fe was one of the first cities in the nation to adopt a higher minimum wage than its surrounding state, in 2003, so this move could continue its status as a national leader in minimum-wage policy. While many minimum-wage increases are tied to inflation and cost-of-living increases, not many regions have explicitly tied wage increases directly to rents, making Santa Fe, yet again, a city to watch.
This Week in Trickle-Down
Rather than renewing the Affordable Care Act tax extensions that would bring down health insurance costs for millions of Americans, Senator Josh Hawley is proposing to establish a tax deduction for American families of up to $25,000 per year of health care payments. “Hawley’s plan here,” economist Sky Marchini pointed out on Bluesky, “is that if the median American family spends $25,000 on healthcare (around a third of their gross income!), the government will give them a $3000 tax break the following April.”
Senator Elizabeth Warren’s office revealed that the “bonus depreciation” policy written into the Trump Administration’s first tax bill has been a tremendous handout to wealthy corporations: “Over 80% of the 100% bonus depreciation claimed by corporations from 2018-2022 went to companies with over $1 billion in yearly income. 99% of bonus depreciation benefits went to corporations making over $1 million annually.”
This Week in Middle-Out
At a time when it feels like America’s health insurance system is irreparably broken, it’s heartening to read the latest post from Mara Heneghan, which outlines three straightforward steps that lawmakers can immediately take to alleviate the medical debt crisis that threatens the economic health of millions of Americans.
This Week on the Pitchfork Economics Podcast
We all know that the curriculum taught in Econ 101 courses has been indoctrinated with trickle-down economics. This week’s podcast offers an interview with two professors who are trying to create a new Econ 101 program that teaches how the economy really works. Columbia University professor Suresh Naidu and University College London professor Wendy Carlin join Nick and Goldy to discuss CORE - Economics for a changing world, a completely free global curriculum reform project that cuts the trickle-down BS out of Econ 101.
Closing Thoughts
I often warn in this newsletter not to confuse anecdotes for economic data. It’s easy to get swept up in the drama of a bracing and persuasive first-person account, and politicians on both sides of the aisle love to use such accounts to justify their favored policy.
But personal stories do matter. As we discussed earlier in this newsletter, all economic metrics are inherently flawed and if you only rely on numbers to measure the economy, it’s possible that you’ll completely miss the real experiences of the real people who have to live in that economy.
So with all that said, I wanted to call your attention to this week’s focus group report from polling firm Navigator Research. It includes quotes from an economic focus group held with political independents from states that are facing hotly contested Senate elections next year, and taken as a whole it paints a bleak picture of what it’s like to be a working American.
When asked about how they felt about the economy, most respondents said they felt afraid or hopeless. One New Hampshire woman talks about how hard it is to get by: “I’m scared. I’m scared. I’m scared of us losing our healthcare, of him not getting the care that he needs, and me not being able to provide for my family, even though I went to school and got a career to do so.”
The employment numbers have shown a slowly weakening labor market, but from the view of people actually trying to find work the situation is much more dire. A Michigan woman explains “I find everything is higher priced around here. I found work, but I’m looking for a higher paying job and that’s been very discouraging. Unemployment’s up higher than it’s been in four years and I don’t see it getting better.”
A New Hampshire woman said, “I’ve applied to over 50 jobs and I’ve heard back from five, if that, and they were all rejections. And again, I’ve been a nurse now for 21 years.”
Lots of respondents talked about the buy now pay later services I mentioned earlier in this newsletter:
“In order to get dog food recently I had to do a split and four payment type plan and I’ve never had to do that before.”
“I buy my groceries with my cash app card so that I can use Afterpay and break the payments down to three or four payments so that I can actually afford the groceries.”
“I think in essence, [Afterpay is] pretty helpful, but l’ve been seeing people use it for stuff like groceries or eating out, which can be a slippery slope. I work in a retail store, people are buying clothes with Klarna, so I guess it’s a bit dangerous.”
And respondents are well aware of the income inequality that’s plaguing the economy.
“I feel like there’s a boiling point that’s happening. If we get too far over, we’re going to go over the edge. It’s going to be not a good place for the US,” a Michigan man accurately explained. “If you’re above a certain median income, then everything is going good. If you’re below it, people are getting frustrated. It’s been like that for a long time, but I don’t know, it just seems like this last year’s just getting worse.”
“We have an interstate highway system because Eisenhower put a 75% wealth tax on the wealthiest people in the country so that we can afford to build the highways. That is reasonable. That makes sense,” a New Hampshire woman said. “Tax the people with the money, not the people without the money.”
The focus group felt as though President Trump and Republicans only have the interests of the richest people and corporations at heart. Multiple respondents maligned Trump’s construction project of a new White House ballroom as a sign of how out of touch they are: “I see the president building a ballroom when there’s people that can’t feed their families,” a Michigan woman said.
But these independents don’t necessarily believe that Democrats are on their side, either. The respondents don’t see the Democrats as being effective at messaging or at executing positive economic policies, or they believe that their words of concern are for show.
Make no mistake: These focus group results are hard to read. They paint a picture of an America where many are falling behind and failing to make ends meet—and worst of all, they don’t believe that anyone is in their corner or fighting for them. They feel abandoned.
The good news is that these quotes help map out a way forward for candidates who do want to make a difference: Speak plainly, and address the very real concerns of people who feel left behind.
One quote in particular sticks with me, from a woman in Maine: “I think nothing’s going to change until our government decides that we’re a priority, that lowering the cost of things is a priority, that giving us affordable health care is a priority,” she says, adding, “And it doesn’t seem to be a priority right now.”
Other nations have established policies that are proven to make health care and housing affordable, and there is growing political will in the people of the United States to enact those policies. The most important thing people who are running for office can do in the coming months as midterm election season begins is making sure that voters know that working Americans are their biggest priority.
Be kind. Stay strong.
Zach